My COVID Odyssey Time Capsule is now in a new site!

Shared Posts (Pingbacks)

COVID-19~Worldwide estimates for Ro in 2020

We se the results in our previous post to calculate worldwide estimates for Ro in 2020 using data up to mid-August 2020.

We obtain the following table:

For more countries see:
COVIDWorldAllCasesCPMNZcorr

Notes:

  1. The date and number of cases are when r* was calculated.
  2. The estimate for Ro is the value in penultimate (second to last) column.
    Round this value to one decimal place.
  3. r* is calculated from spreadsheet data using the following algorithm r* = r (in the third line);
    r is the value in the second line:

Historically we used n = 10 in the formula on the first line above. Most recently we use n = 2.5.

We note that in New Zealand r = 1.4033 and r* = 1.4067, both very close to 1.4 estimated in our previous post:

Covid-19~ Does 1.1r^2.5 provide a good estimate for Ro?

Covid-19~ Does 1.1r^2.5 provide a good estimate for Ro?

We consider whether  for COVID-19, 1.1r^2.5 provides a good estimate for Ro,  the number of people one person may infect when there is no natural immunity.

We have already established that r^2.5 provides a good estimate for the effective reproduction rate Re, where r is the daily increase in case numbers. We want to estimate Ro.

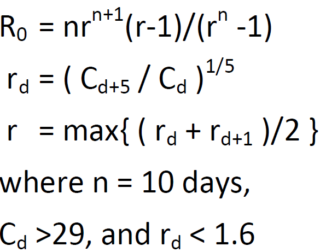
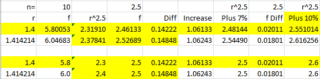
We eventually consider the following table.

The formula at the top of our table is our original estimate for Ro (actually an estimate for Re). For simplicity we call this f.

Originally we used n =10  (since there are 10 days when a person is infectious).

Since we have already discovered that r^2.5 provides a good estimate for Re, we now compare this value for re with the value obtained using the formula when n = 2.5.

The bottom half of the table contains values in the top half rounded to one decimal place.

The last column is our estimate for Ro = 1.1r^2.5

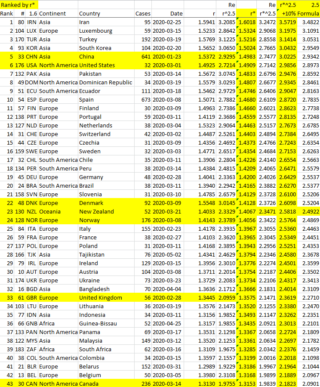
We look at New Zealand data early in the original 2020 outbreak.

We see that r = 1.4 fits the New Zealand case numbers well early in 2020.

nzdata

From the first table we read that for r = 1.4, Ro = 2.6.

One person may on average infect 2.6 others over a 10-day infectious period.

Firstly we look at this table:

We see that on average the formula gives a result that is 7% above the value obtained for r^2.5.

Note that the values highlighted in red would not be obtained in practice.

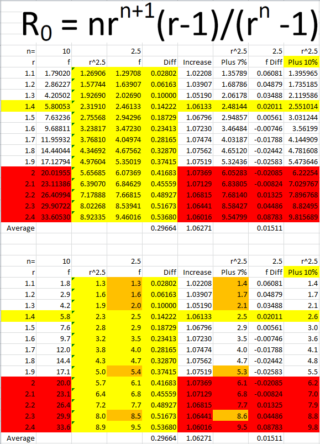
Instead of 7%, we add on 10% to estimate Ro and obtain our original table (see last column):

You may find the PDF easier to read:
COVIDformula2023

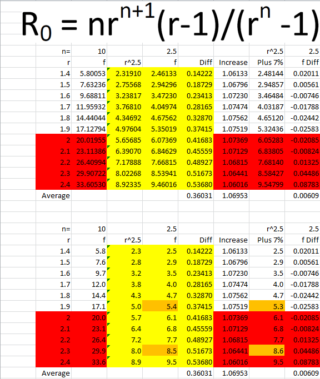
We see that the values for f when n = 2.5 lie between r^2.5 and 1.1r^2.5.

We use this to obtain a range for Ro.

For r = 1.4 (highlighted in yellow) we estimate Ro to be in the range from 2.3 to 2.6.

We use values in the last column (the higher number in our range) as our estimate for Ro.

We conclude that 1.1r^2.5 is a good estimate for Ro.

We note that when r = 1.4 (as in NZ) r^2 =1.96.

This suggests that case numbers may almost double each two days.

This suggests that r = SQRT(2) may provide a good estimate for Ro.

Note that SQRT(2) ~ 1.414214

We conclude that 1.1r^2.5 is a good estimate for Ro.

My main site will become private this morning (Monday 23 October)- links from posts here may not work!

A broken heart

Please do not injure me
We had a synergy
You broke my heart
Tore it apart
Please treat me gingerly

Alan Grace
10 November 2017

My main site:

https://aaamazingphoenix.wordpress.com/

will probably become a private site this morning.

This will not have any effect for existing members of my main site.

This means that links to my main site from this site will not work unless you are a member of my main site.

I recommend you join my main site now if you are not already a member.

Email me if you would like to become a member of my main site.

You are all welcome to become members of my main site.


heartbreak

Daily prompt:Gingerly

COVID Odyssey: Autumn Addendum Post #971~ COVID Odyssey Time Capsule Addendum

COVID Odyssey Addendum

Summer has ceased Autumn’s awesome
My thoughts come least my mind’s caught numb
I feel like an April fool
I have sealed my time capsule
Before adding my addendum

Alan Grace
26 March 2022

The COVID Odyssey website has become an open Time Capsule:
Alan Grace: COVID Odyssey Time Capsule for aaamazingphoenix.wordpress.com – Warning: Most Links within posts will go to the original site: aaamazingphoenix.wordpress.com

A version of this post can be found here:
COVID Odyssey: Autumn Addendum Post #971~ COVID Odyssey Time Capsule Addendum – COVID Odyssey: Alan Grace’s vir[tu]al journey (wordpress.com)

This addendum covers:

  • NZ now has around 600,000 cases of COVID-19
  • Ro can be estimated by using r^1.2 (instead of r) in our formula where r is a daily increase factor in case numbers

This PDF may be easier to read and contains a wider range of values:
CasesReRoC5

The actual value for Ro will lie between our values calculated for Re and Ro.

We could also estimate Ro using r^1.1, the geometric mean of r and r^1.2. We obtain:
CasesReRoD

In the first 2020 Outbreak New Zealand, r =1.4 and hence r^2 = 1.96. This is close to 2 so we thought that when r = 1.4, for Ro, r was close to SQRT(2). At a minimum this could be the case. Let z = ln( SQRT(2) ) / ln(1.4) and use r^z in our formula where z = 1.030021359. This gives the result we require when r = 1.4. We obtain (see image below):

CasesReRoE
CasesReRoE2
(the last two columns show the increase in r when estimating Ro)
CasesReRoE3
(includes Ro/Re)


This provides low estimates for Ro, close to Re as required when r = 1.4. We adopt these estimates.

nzdata

Both Re and Ro are estimated using this formula:

Ro

where n = 10 Days.

For our upper estimate in the range for Ro, substitute r^1.2 for r in the formula.

Please see the WELCOME menu for background and definitions at:
COVID Odyssey: Alan Grace’s vir[tu]al journey – COVID Odyssey: Alan Grace’s vir[tu]al journey investigating/experiencing COVID-19 life (wordpress.com)

Read more